

If you're a data analyst at a SaaS company or an ecommerce business with a subscription component, it is inevitable that you will be asked to analyze metrics like churn, upgrades, and downgrades. These data points help the business understand the health of your subscriber base, specifically:
- The health of your subscriber base even when you have seasonality in renewals (since you amortize your revenue over months)
- The source of revenue changes: new customers, upgrades, downgrades, churns, or reactivations
- The value of a customer based on how long a given user keeps paying you money: customer lifetime value, average contract value
Frequently, this is called Monthly Recurring Revenue (MRR) analysis, with the output looking something like this:
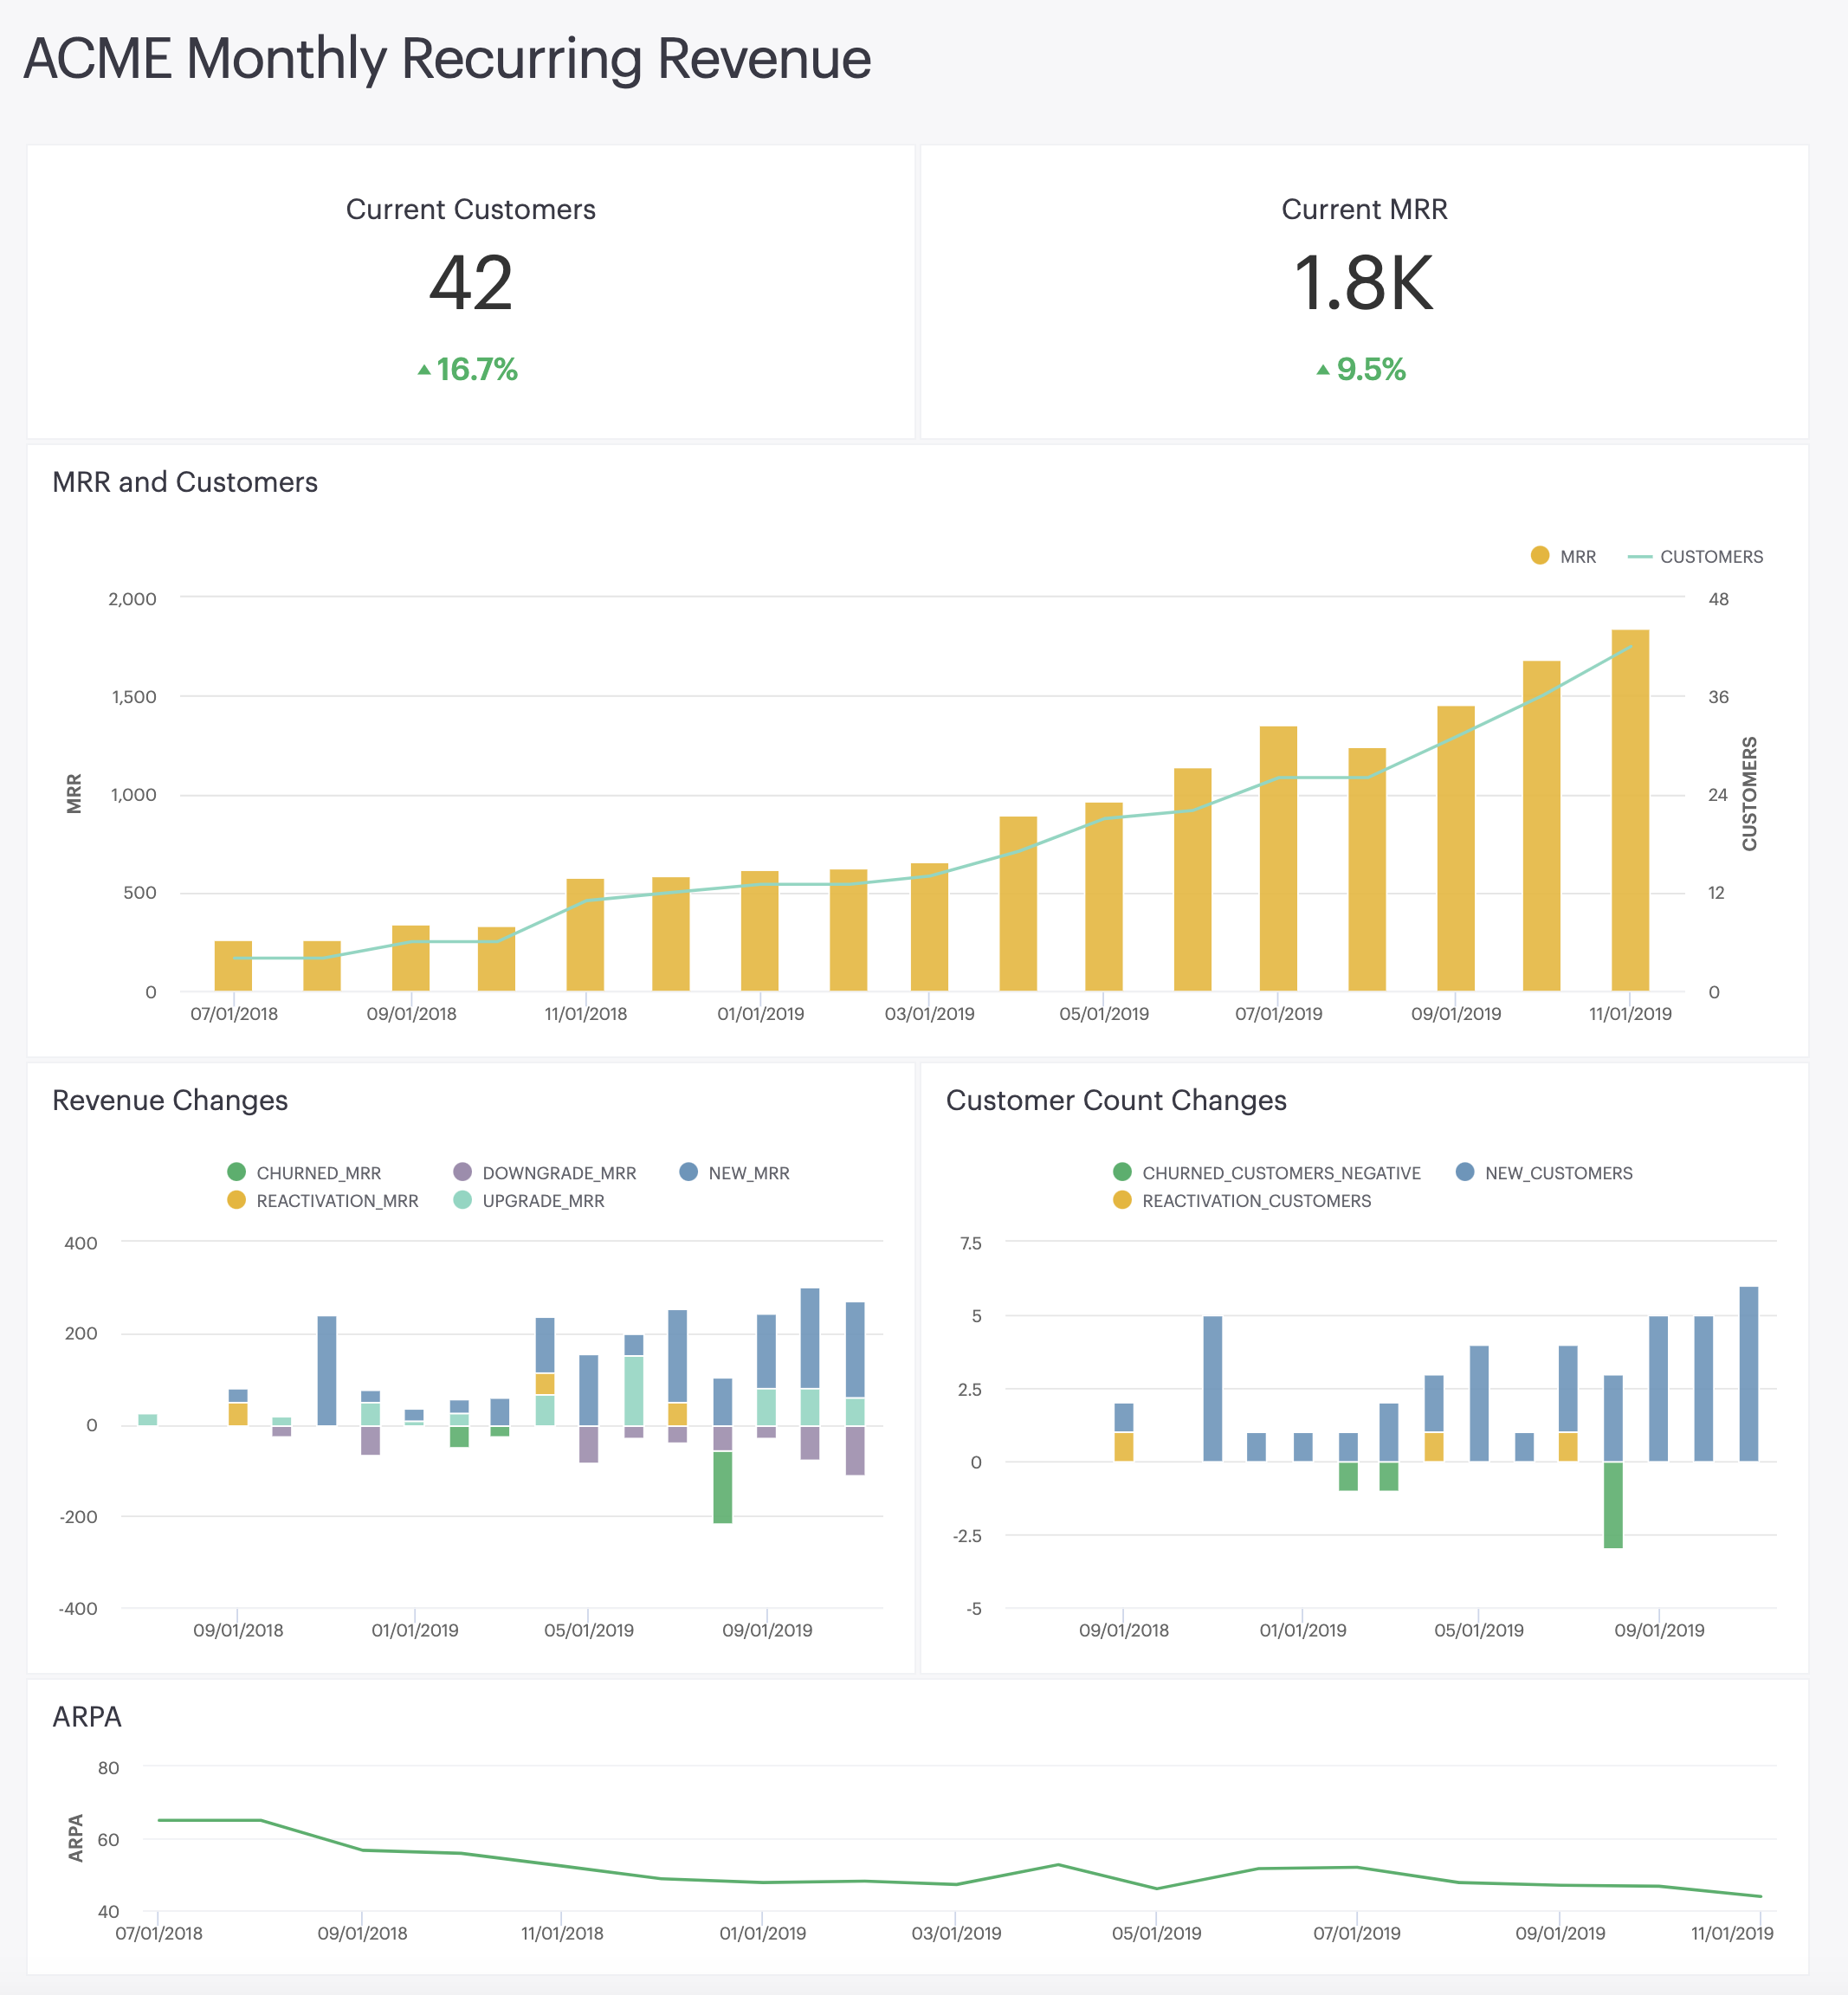
Sometimes, analysts build an MRR dashboard by writing queries on top of raw data. Over time, these queries can become complicated and unwieldy, with logic repeated in multiple places. Our dashboard instead selects from a data model: a table that contains transformed data, and is ready for analysis. As a result, the queries in our dashboard are really simple -- here's one to calculate the number of customers and total MRR for each month:
select
  date_month,
  sum(is_active::integer) as customers,
  sum(mrr) as mrr,
from analytics.fct_mrr
group by 1
Building the dashboard on top of a data model, rather than raw data, offers a number of benefits:
- Your business logic is codified: Every business is unique, and the way your business defines a churn is likely to be subtly different to another business. By building a data model that contains this business logic, you're able to ensure everyone in your business is using the same definition.
- You only have to transform your data in one place: Chances are, your source data for subscriptions isn't perfect. You might need to clean it up, for example casting empty strings to NULL values. Or you may need to change the grain of your tables, for example change a table with one record per subscription with start and end dates, to one record per active month. By doing this in an upstream data model, you won't need to repeat work when building similar analyses, or in different BI tools.
- Your assumptions about your data model can be tested: By building data models in dbt, you can explicitly list and then test any assumptions you're making about your data. For example, if your back-end team tells you that a customer can't have two active subscriptions at once, it's a good idea to add a test to validate that (here's an example).
- Business users can more easily explore the data: If churns looked a little high this month, business users can jump in and write some simple SQL to understand which accounts churned, without getting overwhelmed by complex data.
The MRR data model
Every chart on this dashboard selects from a data model. This model has one record per customer per month (often referred to the "grain" of a model). Each record has the associated monthly recurring revenue (MRR), as well as a change category, which describes the revenue for a customer compared to last month.
| date_month | customer_id | mrr | mrr_change | change_category |
|---|---|---|---|---|
| 2018-11-01 00:00:00.000 | 1 | 50 | 50 | new |
| 2018-12-01 00:00:00.000 | 1 | 50 | 0 | |
| 2019-01-01 00:00:00.000 | 1 | 50 | 0 | |
| 2019-02-01 00:00:00.000 | 1 | 0 | -50 | churn |
| 2019-03-01 00:00:00.000 | 1 | 0 | 0 | |
| 2019-04-01 00:00:00.000 | 1 | 50 | 50 | reactivation |
| 2019-05-01 00:00:00.000 | 1 | 50 | 0 | |
| 2019-06-01 00:00:00.000 | 1 | 75 | 25 | upgrade |
| 2019-07-01 00:00:00.000 | 1 | 75 | 0 | |
| 2019-08-01 00:00:00.000 | 1 | 0 | -75 | churn |
| … | … | … | … | … |
The change categories are worth going through here:
- new: the customer is a new customer that has not had a previous subscription
- churn: last month the customer paid for a subscription, but this month is not. A customer can churn many times
- upgrade: the customer has increased their usage and is now paying you more money per month
- downgrade: the customer has decreased their usage and is now paying you less money per month
- reactivation: a previously churned customer has started subscribing again
If you're ready to dive straight into a dbt project to see how this is done, check out our sample MRR project here. Otherwise read on for a more in depth explanation.
How to model subscription revenue data
Step 1: Gather your required data sources
Before you can transform data, you need to have it in your warehouse. Subscription data can take one of many structures depending on your source system -- here's some common ones:
- A table of subscription periods, with start and end dates
- A table of monthly invoices, with the invoice amount representing the subscription value
- A table of change events, such as upgrades, downgrades, and cancellations
For the purpose of this playbook, we're going to use a table of subscription periods.
| subscription_id | customer_id | start_date | end_date | monthly_amount |
|---|---|---|---|---|
| 1 | 1 | 2018-11-01 | 2019-02-01 | 50 |
| 2 | 1 | 2019-04-01 | 2019-06-01 | 50 |
| 3 | 1 | 2019-06-01 | 2019-08-01 | 75 |
If your subscription data looks different to this, use dbt to transform it into this shape.
Fortunately, our data also happens to be extremely clean:
- Each customer can only have a single active subscription at a time
- The start and end date for each subscription is at the start of the month
We even confirmed that our assumptions are true by applying some dbt tests!
Step 2: Date spine subscriptions to have one record per customer per month
Required SQL technique: date spining | Required dbt technique: packages
Since we want to look at the change month-by-month, we need to fan out our subscriptions to have one record per month, rather than one record per active subscription:
| date_month | customer_id | monthly_amount |
|---|---|---|
| 2018-11-01 | 1 | 50 |
| 2018-12-01 | 1 | 50 |
| 2019-01-01 | 1 | 50 |
| 2019-04-01 | 1 | 50 |
| 2019-05-01 | 1 | 50 |
| 2019-06-01 | 1 | 75 |
| 2019-07-01 | 1 | 75 |
| … | … | … |
Typically, we do this by joining to a table of "months":
select
  months.date_month,
  subscriptions.customer_id,
  subscriptions.subscription_id,
  susbcriptions.monthly_revenue

from subscriptions

inner join months
  -- all months after start date
  on  months.date_month >= customers.date_month_start
  -- and before end date
  and months.date_month <= customers.date_month_end
We use the date_spine macro from the dbt-utils package to generate a table of all months.
But hold up, our customer didn't have a subscription between February (2019-02-01) and April (2019-04-01), and we want to capture that as a "churn" and "reactivation"!
For MRR analysis, it's important to "fill in" any missing months where a customer wasn't active. Rather than do a simple date spine to fan out a subscription period, we write some extra SQL to first find all the months between when a customer was first active, and when a customer was last active, and use those at the start and end dates for our date spine.
with customers as (

  select
    customer_id,
    date_trunc('month', min(start_date)) as date_month_start,
    date_trunc('month', max(end_date)) as date_month_end

  from subscription_periods

  group by 1

),

customer_months as (
  select
    customers.customer_id,
    months.date_month

  from customers

  inner join months
    -- all months after start date
    on  months.date_month >= customers.date_month_start
    -- and before end date
    and months.date_month <  customers.date_month_end

)

-- join the customer_months spine to MRR base model
joined as (

  select
    customer_months.date_month,
    customer_months.customer_id,
    coalesce(subscription_periods.monthly_amount, 0) as mrr

  from customer_months

  left join subscription_periods
    on customer_months.customer_id = subscription_periods.customer_id
    -- month is after a subscription start date
    and customer_months.date_month >= subscription_periods.start_date
    -- month is before a subscription end date
    and customer_months.date_month < subscription_periods.end_date

)
...
Step 3: Identify the first- and last-active months for a customer
Required SQL technique: Window functions
Now that we have all the months for a customer, we can start building some fields to help us categorize the changes. In particular, we're going to find out if each record represents the first or last month for a customer.
...
final as (
  select
    date_month,
    customer_id,

    mrr,

    mrr > 0 as is_active,

    -- calculate first and last months
    min(case when is_active then date_month end) over (
      partition by account_id
    ) as first_active_month,

    max(case when is_active then date_month end) over (
      partition by account_id
    ) as last_active_month,

    -- calculate if this record is the first or last month
    first_active_month = date_month as is_first_month,
    last_active_month = date_month as is_last_month

  from joined

)

select * from final
Step 4: Generate a "churn" month
Our customer's last subscription finished in July, so they should get marked as a churn in August. However, we don't have a record for August in our date spine! So let's create it.
To do this, select the last active record for each customer, and adjust the month value to be one month in the future. Fill in the rest of the columns to denote that this was not an active month.
select
  dateadd(month, 1, date_month)::date as date_month,
  customer_id,
  0::float as mrr,
  false as is_active,
  first_active_month,
  last_active_month,
  false as is_first_month,
  false as is_last_month

from mrr

where is_last_month
Then, downstream, union the results of this query with the other records so we finally have all of our months for a customer.
with unioned as (

  select * from {%raw%}{{ ref('mrr_xf') }}{%endraw%}

  union all

  select * from {%raw%}{{ ref('mrr_last_churn') }}{%endraw%}
)
...
Step 5: Use window functions to find the MRR for a previous month
Remember that our change category is relative to last month, so we have to use some lag functions to find what a customer paid last month, and then the relative dollar change.
select
  *,

  coalesce(
    lag(is_active) over (partition by customer_id order by date_month),
    false
  ) as previous_month_is_active,

  coalesce(
    lag(mrr) over (partition by customer_id order by date_month),
    0
  ) as previous_month_mrr,

  mrr - previous_month_mrr as mrr_change

from unioned
Step 6: Add the MRR change category
We now have all the pieces to do our change categorization! And it turns out the SQL is pretty easy after all that work! 😌
...
case
  when is_first_month
      then 'new'
  when not(is_active) and previous_month_is_active
      then 'churn'
  when is_active and not(previous_month_is_active)
      then 'reactivation'
  when mrr_change > 0 then 'upgrade'
  when mrr_change < 0 then 'downgrade' end as change_category
Step 7: Write your data tests & documentation
We've written this here as a final step, but this should be a continuous process while you develop your models. Whenever you make assumptions about your data, add a test to make sure that assumption is valid (like we did for our source data). We also like to add tests for uniqueness, as well as assert which columns shouldn't be null.
This model should go live with at least the following tests: Tests on your source data to checks your assumptions Tests on your final model to ensure you haven't made any mistakes in your SQL, in particular: Test your primary key using both a unique and not_null test (this helps catch fanouts!). Include not_null tests on other columns. In addition, you'll likely add tests over time to catch edge cases that you can't anticipate right now.
Finally, add documentation so your stakeholders understand each column.
Step 8: Ship it!
Your first version of this won't be perfect! As soon as you get an MVP working, commit it to your dbt project, and build some dashboards so your stakeholders can get it in their hands.
User-test it with your stakeholders to find any issues, and understand whether they are important enough to fix before sharing the dashboard with the wider business. Don't wait for your work to be perfect before sharing it!
Making it your own
While the methodology to modeling subscription revenue is the same for all recurring revenue businesses, the nuances of your business will change some details on how you implement this.
- What is your business' tolerance for numbers that don't perfectly match with financial reports?
- Does your business allow users to pause subscriptions? Should this be tracked differently than a churn?
- What is your base unit of measure (i.e. customer, account, product)?
- Are there any add-on costs that are useful to add as an attribute on this table?
- How should partial months be handled?
- Do all subscriptions get charged on the same day, or do they get charged on a different day for each customer? If the latter, what is the business rule for the month that the revenue gets recognized in?
These can seem like quick fixes, but this is where most of the work will lie. Many of these decisions will result in tradeoffs --- remember that an MRR dashboard should help business users understand the health of a business, rather than be used for financial reconciliation. While perfect reconciliation can sound like a good thing to aim for, you can end up falling down a rabbit hole trying to find out where that $0.02 went.
We recommend you communicate with stakeholders to align them on what an MRR dashboard should and shouldn't be used for, as well as ensure you understand your business' tolerance for slight mismatches in numbers.
See the code
We've built a dbt project with some sample data to see it in action:
Last modified on: Mar 21, 2024

Achieve a 194% ROI with dbt Cloud. Access the Total Economic Impact™️ study to learn how. Download now ›